Increase Business Efficiency with HubSpot Reports & Dashboard Features
HubSpot is a great tool for marketing, sales, and customer support teams trying to make their work more efficient. As your business grows, it can be tough to keep track of all your marketing efforts spread across different platforms. That's where HubSpot Reporting comes in handy. It gives you a clear view of all your marketing campaigns, projects, and resources, making it easier to plan your Inbound marketing strategy and decisions.
What Is HubSpot Reporting?
HubSpot Reporting is a tool within the HubSpot platform that helps businesses track and understand their customer-related activities. HubSpot itself is a platform designed to aid businesses in attracting, converting, and delighting customers. The reporting features of HubSpot gather information from its marketing, sales, and service hubs in the CRM (Customer Relationship Management) system, offering a comprehensive view of various business initiatives.
With HubSpot Reporting, you can easily access insights without the need to refresh, clone, or update reports. The system comes with built-in features and templates, simplifying the process of understanding and utilizing its functionalities.
In this article, we'll explore the details of HubSpot Reporting and how it can benefit your business in the long term.
What Do We Mean by Marketing and Sales Reporting?
In today's data-driven business landscape, marketing and sales reporting are essential tools for measuring performance, optimizing strategies, and driving growth. But what exactly do we mean by these terms?
Marketing reporting focuses on tracking the effectiveness of marketing campaigns and initiatives. This typically involves measuring metrics such as:
- Website traffic and engagement: How many people are visiting your website, and how are they interacting with it?
- Lead generation: How many leads are you generating from your marketing campaigns, and what is the quality of those leads?
- Brand awareness: How well-known is your brand, and how is it perceived by your target audience?
- Customer acquisition cost (CAC): How much does it cost to acquire a new customer?
- By analyzing these metrics, marketers can gain valuable insights into what's working and what's not, and make adjustments to their campaigns accordingly.
Sales reporting, on the other hand, focuses on tracking the performance of the sales team and the sales pipeline. This typically involves measuring metrics such as:
- Sales pipeline: How many leads are in the pipeline, and at what stage are they?
- Conversion rates: What percentage of leads are converted into customers?
- Average deal size: How much revenue are you generating from each sale?
- Sales cycle length: How long does it take to close a sale?
By analyzing these metrics, sales managers can identify areas for improvement and make data-driven decisions about how to allocate resources and optimize the sales process.
The importance of Combined Reporting
It's important to note that marketing and sales reporting are not isolated activities. They are two sides of the same coin, and they should be viewed in conjunction with each other. By combining marketing and sales data, you can gain a holistic understanding of your customer journey and identify areas where you can improve your overall sales and marketing performance.
For example, you might find that your marketing campaigns are generating a lot of leads, but that the sales team is struggling to convert those leads into customers. This could indicate that the leads are not qualified, or that the sales process is inefficient. By combining your marketing and sales data, you can identify the root cause of the problem and take steps to fix it.
What Is HubSpot Reporting?
HubSpot's reporting system covers both marketing and sales data comprehensively, offering a complete view of the customer journey from start to finish in your sales funnel. This helps identify what attracts most visitors to your sales funnel.
What sets HubSpot ap art is its integrated CRM platform with built-in tools, especially for crafting marketing strategies.
In terms of reporting, HubSpot has three sub-categories:
1. HubSpot Reports
HubSpot has default templates for reporting your sales and marketing data. You can access these reports from the library section available under Reports section. You can customize its elements depending on your requirements, or you can also a create an all new custom report from scratch to meet your custom business requirements.
HubSpot reporting tools will give you compact and to-the-point segments of data, which will make it easier to comprehend. You can view these data in the dashboard of this HubSpot reporting tool. At the end of the day, if any data doesn't make sense to you or your team, you can't rely on this info to make important marketing decisions. Here're some of the types of HubSpot Reports,
Types of Reports:
- Standard Reports: Pre-built reports covering essential metrics in marketing, sales, service, and operations.
- Custom Reports: User-created reports tailored to specific business needs and questions.
- Attribution Reports: Track the impact of marketing and sales activities on revenue and customer acquisition (available in Marketing Hub and CMS Hub Enterprise).
- Revenue Analytics: Dive into revenue trends, forecasts, and deal progression insights (available in Sales Hub Professional and Enterprise).
- Custom Report Builder: The most flexible tool for in-depth analysis, enabling you to combine data from multiple sources and create highly customized reports.
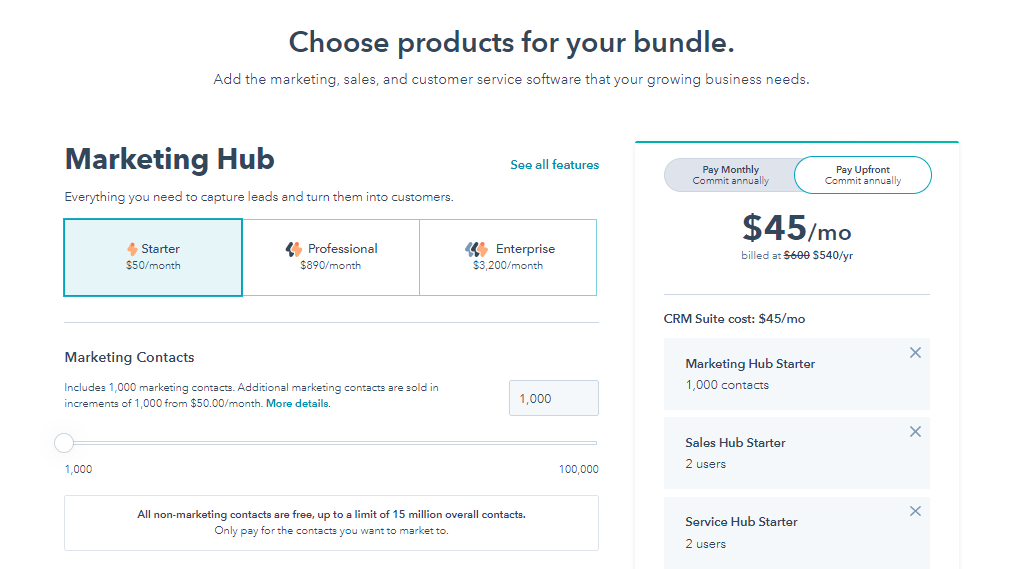
Having said that, most of the customizable features of HubSpot reporting come with the add-on versions. If you are already using any of the HubSpot's Pro or Enterprise plans, the HubSpot reporting features are already available to you under Reports section.
Key Features of HubSpot Reports:
- Unified Data Hub: Seamlessly integrates data from across HubSpot's suite of tools (Marketing, Sales, Service, Operations, CMS), providing a single source of truth for all your reporting needs.
- Custom Report Builder: Offers unparalleled flexibility to create highly tailored reports, combining objects, events, activities, and custom properties to answer any business question.
- Visually Appealing and Informative Charts: Choose from a variety of chart types (bar, line, pie, donut, gauge, table, pivot table) to visually represent your data and uncover trends.
- Customizable Dashboards: Assemble multiple reports into visually compelling dashboards, enabling you to track key metrics and share insights with stakeholders.
- Real-time Data: Access up-to-the-minute information to make informed decisions and respond to opportunities quickly.
- Drill-Down Capabilities: Explore data in detail by drilling down into specific segments for deeper analysis.
- Filter and Segmentation Options: Narrow down your data to focus on specific areas of interest using filters and segmentation tools.
- Export Functionality: Download reports as CSV or PDF files for further analysis or sharing.
- Sharing and Permissions: Control who can view and edit reports, ensuring data confidentiality and security.
2. HubSpot Analytics Tools
Dealing with heaps of raw data is quite a hassle, which makes it difficult to bring out the essence and meaning of those datasets. The HubSpot analytical tools can be of great help in these types of scenarios. On top of better organization and management, you will have a much deeper understanding of your own data. All of these can greatly enhance your efficiency in your marketing strategies. Let's talk about some of the most important analytics tools in the HubSpot reporting solutions: -
Analytics Tools
The analytics tools keep a detailed record of the behavior of your web traffic. Having a better knowledge of your regular visitors, you better tailor your marketing tactics according to their taste. Some of the things you can track using these analytic tools are: -
- Where do your customers come from?
- How are your subject clusters performing on your website?
- How UTM attributes are affecting your traffic analytics?
You can also examine data on KPIs like conversion ratios, potential clients, and real-time monitoring of your page views.
Website Analytics
The website analytic tools will give you a detailed summary of the performance of your website. You can know everything about your website within a certain time frame. Some of the common parameters are mean time spent, the number of clicks, bounce ratios, conversion ratios, and much more.
Ads
This feature allows you to monitor the performance of your ads across numerous platforms. To have everything under one roof, you can integrate Facebook, Linkedin and even Google to monitor any ads you might have posted on these platforms. Some of the important metrics that you can monitor are the number of impressions, click-through rate, viewers, and many more. You can also view them in your dashboards, where the data can be presented in a graphical form to give you a better understanding of your performance.
Marketing Analytics
As the name suggests, it can give you detailed info about all your marketing campaigns. You can view these analytics over 5 different categories: -
- Influenced contacts
- Sessions
- New contacts
- Influenced deals
- Influenced revenue
Using this tool, you can get a detailed performance report on every small element starting from call-to-actions to blog views and even monitoring the performance of your social media engagements.
3. HubSpot Dashboards
The HubSpot dashboard is probably the most intriguing feature of this HubSpot reporting solution. These dashboards can offer small chunks of info that are easy to comprehend. You can get a brief idea about all your campaigns and reports just by going through your HubSpot dashboard once.
HubSpot has some standard default dashboards directed toward sales, customer service as well as marketing.
Marketing Dashboards:
- Go beyond basic KPIs: While standard dashboards track visitors, engagements, and conversions, utilize HubSpot's custom report builder to delve deeper. Analyze lead sources, landing page performance, email campaign effectiveness, and even marketing ROI (Return on Investment).
- Dive into attribution: Use Marketing Hub Enterprise's attribution reports to understand the true impact of your marketing efforts. Track how touchpoints across channels contribute to conversions, optimize your marketing mix, and maximize campaign budgets.
- Visualize funnel progression: Build custom dashboards to monitor your marketing funnel at each stage, from awareness to lead generation, nurture, and conversion. Identify bottlenecks, refine your lead nurturing process, and improve conversion rates.
Sales Dashboards:
- Drill down beyond deal metrics: The default dashboard provides a good overview, but go further by analyzing individual salesperson performance, sales cycle stages, pipeline health, and customer churn.
- Predict future performance: Leverage Sales Hub Professional and Enterprise's revenue analytics to forecast future revenue, identify deal risks, and adjust your sales strategy proactively.
- Integrate with external data: Use the HubSpot App Marketplace to connect your dashboard with CRM or sales intelligence tools. Enrich your sales data with market trends, competitor insights, and lead scoring information for more informed decisions.
Service Dashboards:
- Track customer satisfaction: Beyond ticket metrics, monitor customer sentiment through satisfaction surveys and analyze trends in CSAT (Customer Satisfaction Score) and NPS (Net Promoter Score).
- Identify agent performance: Analyze individual agent metrics like ticket resolution time, first contact resolution rate, and customer feedback to identify areas for improvement and coaching opportunities.
- Automate reporting: Schedule automatic refresh and delivery of dashboards to key stakeholders, ensuring everyone stays informed about customer service performance.
Additional Features:
- Customizable filters: Apply dynamic filters across reports on a dashboard to focus on specific regions, teams, or product lines for granular insights.
- Conditional formatting: Highlight critical data points using pre-defined rules, drawing immediate attention to areas requiring action.
- Mobile access: View dashboards and reports on the go using the HubSpot mobile app, keeping you informed and connected even while traveling.
These dashboards are highly customizable and can hold up to ten different reports. You can easily remove or add any type of report, which might give you a better insight into your performance.
Benefits of HubSpot Reporting
In today's data-driven business landscape, having access to accurate and actionable insights is crucial for success. HubSpot Reporting stands out as a powerful tool, offering numerous benefits for businesses of all sizes and across various industries. Here's a breakdown of the key advantages:
1. Data Centralization and Unified View:
- HubSpot acts as a central hub, seamlessly integrating data from marketing, sales, service, and operations. No more juggling disparate spreadsheets or struggling to find the information you need.
- Gain a holistic view of your customer journey, understanding how marketing efforts generate leads, sales convert them into customers, and service keeps them satisfied.
2. Customizable and Flexible Reporting:
- Go beyond standard reports: Build custom reports tailor-made to answer your specific business questions. Combine diverse data points from various objects and properties to uncover hidden trends and patterns.
- Visualize data effectively: Choose from a variety of chart types (bar, line, pie, etc.) and customize dashboards to present key metrics in a clear and compelling way, facilitating understanding and action.
3. Actionable Insights and Data-Driven Decision Making:
- Identify areas for improvement: Analyze KPIs and identify areas where marketing campaigns are underperforming, sales processes are inefficient, or service is falling short.
- Optimize strategies and allocate resources effectively: Use data-driven insights to make informed decisions about marketing budget allocation, campaign optimization, sales pipeline management, and customer service improvements.
4. Improved Collaboration and Alignment:
- Share dashboards and reports with team members across departments, fostering transparency and collaboration.
- Ensure everyone is working towards the same goals by aligning marketing, sales, and service teams through shared data and insights.
5. Real-time Data and Proactive Response:
- Access up-to-the-minute information to make informed decisions and respond quickly to opportunities or challenges.
- Monitor key metrics in real-time to identify potential issues before they escalate, taking proactive measures to mitigate risks and ensure smooth operations.
6. Scalability and Integration:
- HubSpot scales with your business: As your data volume and reporting needs grow, HubSpot's reporting capabilities adapt to handle the complexity.
- Integrate with external data sources: Leverage the HubSpot App Marketplace to connect your dashboards with additional tools and databases, enriching your data analysis and gaining even deeper insights
7. Enhanced ROI and Business Growth:
- By optimizing campaigns, improving sales processes, and delivering exceptional customer service, HubSpot reporting empowers you to maximize your return on investment.
- Drive sustainable business growth by making data-driven decisions that improve customer acquisition, retention, and overall business performance.
How To Tap into the Full Potential of HubSpot Reporting?
HubSpot reporting is quite a wholesome solution, however, it has some limitations to its efficiency. You can fill these gaps using some third-party tools, to speed up your operations. So, what should you do to improve the efficiency of HubSpot Reporting?
Train Your Staff
Apart from its range of products, HubSpot offers a comprehensive training program that covers all the topics around inbound marketing and also regarding sales.
In various inbound fields, you and your entire staff could get HubSpot certifications. These certifications can subsequently be displayed on their LinkedIn accounts. This will also help you to build trust among your visitors. You can also provide educational links about the HubSpot CRM platform to your employees, which they can view in their own free time.
Integration of Your Tools
HubSpot is compatible with around 200 applications, so you should integrate them to get everything under one roof.
It will be way easier for you to keep an eye on all your integrations and have everything at your fingertips, rather than having to go through different applications and programs to obtain the data or resources you require. HubSpot addresses this problem by merging with key marketing and sales platforms, along with some of the smaller programs like emailing tools, advanced analytics, and some project management solutions.
Using HubSpot's Campaign Tracking Features
You do not have to develop a campaign to use HubSpot, and most businesses are so enamored with the platform's other features that they usually forget about campaign tracking functionalities.
However, working with campaigns has significant advantages, particularly in terms of reporting. A campaign can be attached to any blog, landing page, or any social marketing post. While using it, you will get a bird's eye perspective of all your moving elements, and you can also analyze them side-by-side in the campaign dashboard.
HubSpot Reporting
The HubSpot reporting feature is currently one of the best in the market. HubSpot allows you to create your own unique dashboards or reports, that will help you see the KPIs the moment you enter the platform. You could use a variety of parameters to gather the exact facts you need to dig further or create bespoke reports. You can get a brief overview of your elements by just giving a glance at your dashboard.
HubSpot's reporting tool can instantly produce customizable charts and graphs. You can distribute them to your coworkers and utilize them to produce detailed updates, on a regular basis.
Final Thoughts
If you want to stay on top of your data and metrics, then you have to find ways to optimize your HubSpot reports. Make sure to go through all the features of HubSpot reporting, and understand which third-party tools might be perfect to complement your HubSpot reporting model. Keep an eye on your data, and make regular changes to see which metrics are working better. If you can keep your reports straight, then each of your decisions can add a lot of value to your business.